- We are Customer Obsessed
- Our Colleagues Make the Difference
- We Run It Like We Own It
- We Strive to Always Do the Right Thing
- We are One Zoetis
| $ Millions (Except Per Share Data) | 2013 | 2012 |
|---|---|---|
| Revenue | 4,561 | 4,336 |
| Net Income Attributable to Zoetis | 504 | 436 |
| Diluted Earnings per Share | 1.01 | 0.87 |
| Net Cash Provided by Operating Activities | 681 | 454 |
| R&D Expense | 399 | 409 |
| Total Assets | 6,558 | 6,262 |
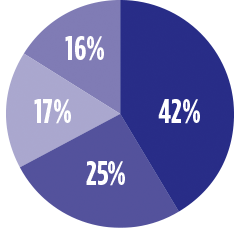
| United States 42% | |
| Europe, Africa and Middle East 25% | |
| Canada and Latin America 17% | |
| Asia Pacific 16% | |
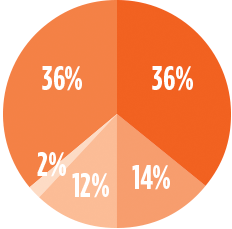
| Cattle 36% | |
| Swine 14% | |
| Poultry 12% | |
| Other 2% | |
| Companion Animal 36% | |
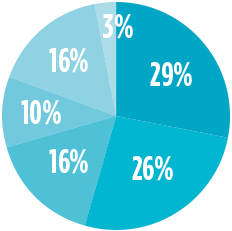
| Anti-infectives 29% | |
| Vaccines 26% | |
| Parasiticides 16% | |
| Medicated feed additives 10% | |
| Other pharmaceuticals 16% | |
| Other non-pharmaceuticals 3% | |
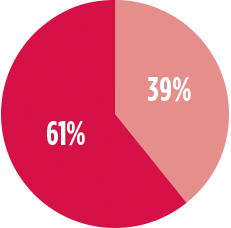
| Top ten product lines 39% | |
| All other product lines 61% | |
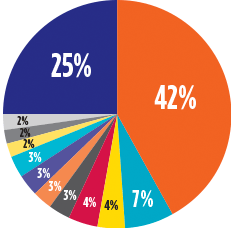
| United States 42% | Germany 3% | ||
| Brazil 7% | Japan 3% | ||
| Canada 4% | Italy 2% | ||
| Australia 4% | Spain 2% | ||
| United Kingdom 3% | China 2% | ||
| France 3% | Other 25% | ||